
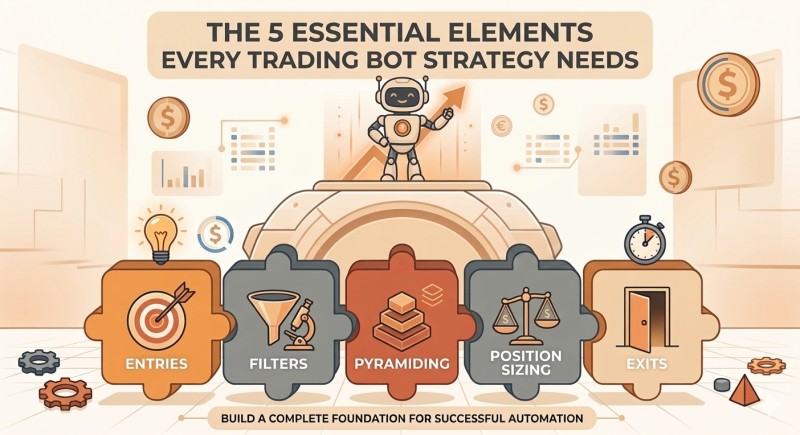
- Entry logic - why you take the trade
- Entry qualifiers - filters that confirm the setup
- Pyramiding rules - how many times you add to a position
- Position sizing - how much capital you risk
- Exit logic - how you lock in gains or cut losses
How Trade Bots Work, Where They Fail, and What to Check First
3 October, 2026
0 comments
What a Trade Bot Actually Does With Your Strategy
A bot doesn't come with a strategy. It takes whatever strategy you give it and turns it into code. That’s the whole point.
It reads market data, checks your rules, then sends orders to a broker or exchange. It tracks fills, manages positions, and logs results. Same structure works for stocks, crypto, options, futures, or even simple machine-learning models.
You can’t just slap code on a hunch and call it automation. A signal like “buy when RSI crosses above 30” isn’t a strategy. It doesn’t say why it works, when to ignore it, or how much to risk. A bot follows rules, but it won’t invent them for you.
The operational loop looks like this: read inputs, compare to rules, generate order, route it, track the result, respond to market changes, and record metrics. Miss one step, and your bot can blow up while you sleep.
Automation does not replace a defined strategy. It just executes it faster - and potentially with more capital.
Bots stay active when you’re not watching the market. But they also stay stupid when your assumptions break.
The Five Pieces Every Trade Bot Needs
A March 2026 framework says a complete strategy has five parts. Skip one, and your bot fails the moment reality shifts.
Five essential strategy parts
These aren’t suggestions. They’re the bare minimum. A strategy is one system. Tweak one piece, and you’ve changed the whole thing.
Entry Logic: Why the Bot Takes a Trade
Good entry logic starts with a testable assumption about market behavior. “Price crossed above the 20-day moving average” is just a condition. You need to say why it matters.
Say it like this: “Breakouts above recent highs tend to continue.” That’s explainable. A 15-indicator mashup fitted to history has no clear behavior behind it. No way to tell signal from noise when things go wrong.
The operator should be able to state what behavior is expected, which conditions confirm it, and when the assumption is no longer valid.
Your entry rule should fit the market it trades. Trend-following entries need trending conditions. Mean-reversion needs range-bound ones.
Entry Qualifiers: When Not to Take a Trade
Raw signals lie. Especially in choppy markets. Moving-average crossovers fire off false entries all the time.
Qualifiers filter the noise. Trend filters, volume checks, multi-timeframe confirmation, time windows, volatility gates. Each one should reinforce your entry assumption.
Common entry filters
- Trend filter: long entries only above a longer-term moving average
- Volume filter: require above-average volume on the entry bar
- Multi-timeframe: a 15-minute signal only if the four-hour chart is bullish
- Time filter: no entries outside intended trading hours
- Volatility filter: skip trades when volatility is outside the tested range
Adding filters just to boost backtest results hides overfitting. You end up with a rule set nobody can explain - including you, six months later.
Pyramiding and Scaling: How Many Times to Enter
Can your bot add to a winning position? How many times? What are the limits?
Single-entry strategies are simple. They fit mean-reversion setups that expect a quick return to fair value.
Pyramiding adds to positions already moving your way. Great for trends. Also concentrates capital fast. Need hard caps on total size and risk.
If the price does not rebound, averaging down compounds the loss.
Averaging down only works if the strategy is built for it - strict max position limits, tested recovery logic. Slap it onto a trend-following bot, and you’re fighting the tape with everything you own.
Position Sizing: How Much Capital Is on the Line
Sizing connects your strategy to capital preservation. Fixed quantity? Easy. Doesn’t adjust to growth, drawdowns, or volatility.
Fixed percentage? Risk 1% per trade. Scales with account size. Preserves capital during drawdowns.
Volatility-adjusted? Bigger positions when volatility is low. Smaller when it spikes. Use ATR or Bollinger Band width to measure.
Sizing approaches
- Fixed quantity: always trade 0.1 BTC or $100
- Fixed percentage: risk 1% of total capital per trade
- Volatility-adjusted: scale position size with ATR or Bollinger Band width
No matter the method, cap risk per trade. If you’re pyramiding or averaging down, the combined exposure still can’t blow past your limit. One percent to two percent per trade, tops.
Exit Logic: Protecting Gains and Cutting Losses
Exits do three things: realize gains, limit losses, leave room for the move to develop.
Fixed targets are simple but dumb. “2% target, 1% stop.” Fine for range-bound markets. Breaks down when conditions shift fast.
Partial exits split the difference. Close half at the first target, trail the rest. Trailing stops lock in profits as price moves in your favor.
A trend-following strategy generally needs an exit that captures extended moves, not small fixed targets.
Decide up front: go flat after exit, or reverse? Always-long or always-short keeps exposure one-sided. Reversal systems can whipsaw in chop.
How a Complete Trend-Following Bot Works
Here’s the full package, with all five pieces wired together:
Integrated trend-following example
- Entry signal: price closes above the 20-day high
- Entry assumption: breakouts above recent highs tend to continue
- Entry qualifiers: price above 50-day MA, volume above average
- Pyramiding: add one position if price moves 5% higher; max two positions
- Position sizing: risk 1% on initial entry, 0.5% on pyramid, no more than 1.5% total exposure
- Stop loss: initial stop at recent swing low
- Exit rules: move stop to break-even at 10% gain, close 50% at 15%, trail remainder with 5% trailing stop
Buy when RSI crosses above 30 and sell when it crosses below 70" defines a signal, not a strategy.
It has no behavioral assumption. No filters. No sizing. No exit plan. No rules for partial fills or shutdown. Just a signal.

The difference? One explains why it takes the trade, confirms it before entry, risks controlled capital, and protects gains. The other guesses.
Reading Market Data and Generating Signals
What your bot sees depends on what data you feed it. Prices, volume, order books, technical indicators, news, fundamentals, model outputs.
Take the AI news bot. It reads headlines, scores sentiment, and trades crypto based on that score. Simple idea. Hard to pull off right.
News bot setup
- Source: Google News RSS filtered by coin name and recency
- Sentiment analysis: OpenAI mini model vs VADER and TextBlob
- Output: -1.0 to 1.0 score mapped to trade direction and size
- Trigger: one-minute scheduled check on news flow
VADER and TextBlob failed because they scored language, not context. “Microsoft shareholders to vote on Bitcoin proposal” scored neutral to them. GPT saw the bullish implication. That’s why domain-aware models matter for crypto sentiment .
The news bot worked - until major sentiment shifted faster than it could react. Stop losses became critical.
Order Creation, Routing, and Exchange Connectivity
Your bot generates signals. Now what? It routes orders to a broker or exchange via API.
Market orders fill at the best available price. Limit orders guarantee price, no guarantee of fill. Both can bite you if you’re not watching execution quality.
A market order for 1 BTC might walk three levels of the order book. First 0.00001 BTC at 75,743.23 EUR. Then 0.012 at 75,752.28. Then 0.00799 at 75,752.35. Average? Higher than the best displayed ask. That’s slippage in action.

Exchanges validate everything. Wrong size, bad symbol, regional restriction? Rejected before it ever hits the book. Rules change too. What worked yesterday might fail today.
Handling Disconnections and Unknown Order States
Networks drop. Exchanges go into maintenance. APIs timeout. And here’s the worst part: you never know if your order actually reached the exchange.
Three nasty scenarios: the request never arrives, the response gets lost, or it shows up late and executes at a terrible price.
Blind retries? Recipe for duplicate orders and double your losses. You need state-aware logic that tracks what’s in flight.
Local order data can become stale during a disconnection. Don’t trust yesterday’s snapshot.
Some platforms let you block until reconnected, others fail instantly. Pick your poison. The key? Handle each order only once, even after reconnect.
Market Making, Inventory Risk, and Dynamic Execution
A UChicago trading competition case study built a futures market-maker for electricity contracts. Won two of three heats.
Market makers narrow bid-ask spreads. But they still own inventory risk. Price moves against you before you close? Losses stack up.
Market-making adjustments
- Fade parameter: widen quotes as position gets lopsided
- Slack parameter: adjust edge (0.05 to 0.15) based on competition
- Multiple price levels: offer more at wider spreads
- Live parameter tuning: tweak edge, fade, size, slack mid-trade
The edge? Aggressive trading + smart use of position limits. Size matters less than timing and risk controls.
Backtesting, Testnets, and Live Review
Backtests look great on paper. Reality laughs.
The Logistic Regression bot scored 88.5% accuracy in validation. Then 2021 hit - a strong market year. Even a random APE profile gained 13.72%. Market conditions masked the strategy’s real edge.
A strategy’s backtest is not necessarily its live result.
Testnets simulate order books and balances. But they don’t simulate slippage, latency, or emotional stress. Live trading introduces all three.
Validation layers
- Historical backtesting: replay past prices and signals
- Paper trading: simulate live conditions without risk
- Testnets: use exchange sandboxes (Binance Testnet, BitMEX)
- Live review: track execution quality, fills, and PnL
Start small. Validate each assumption. Then go bigger - cautiously.
Recording Trades and Measuring Performance
You can’t manage what you don’t measure. Especially when machines do the trading.
Track win rate, average PnL, total fees, drawdown, profit factor, execution quality. Across thousands of trades, tiny leaks sink ships.
Key performance metrics
- Win rate: percentage of profitable trades
- Average PnL: mean profit or loss per trade
- Gross profit vs gross loss: profit factor
- Cumulative PnL and drawdown: equity curve analysis
- Slippage: difference between expected and actual execution price
The best setups log everything. Every fill, every fee, every missed signal. Because when something breaks, you’ll want the receipts.
Failure Modes That Kill Trade Bots
Bots fail in predictable ways. Usually the same ones.
Common failure points
- Incomplete strategy design: no assumption, no filters, no sizing
- Overfitted signals: curve-fit to history, no edge left
- Execution gaps: slippage, partial fills, stale prices
- Network chaos: disconnections, unknown order states, duplicates
- Model latency: accurate but too slow during major news events
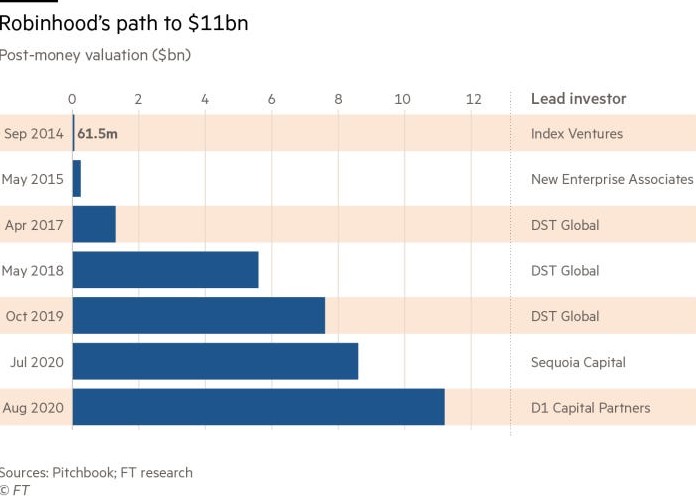
News bots work fine - until surprise sentiment hits faster than the model can parse it. Robinhood bots don’t dodge that either.
Algorithms may not adapt fully to changing market conditions and may not be suitable for every investor.
Platforms know this. They say so in disclaimers. That doesn’t make it less true for you.
Where Trade Bots Fit Today
From AI-driven news scorers to statistical models on futures markets , bots live everywhere now.
But the hype is louder than the results. TradingView webhook routers , centralized exchange integrations , gold-backed tokens - all claiming edge. Most don’t deliver.
The bots that survive do three things well: clear strategy, robust execution, honest measurement. Everything else is noise.
Related posts


Comments on “How Trade Bots Work, Where They Fail, and What to Check First”
No comments yet. Be the first to share your thoughts.